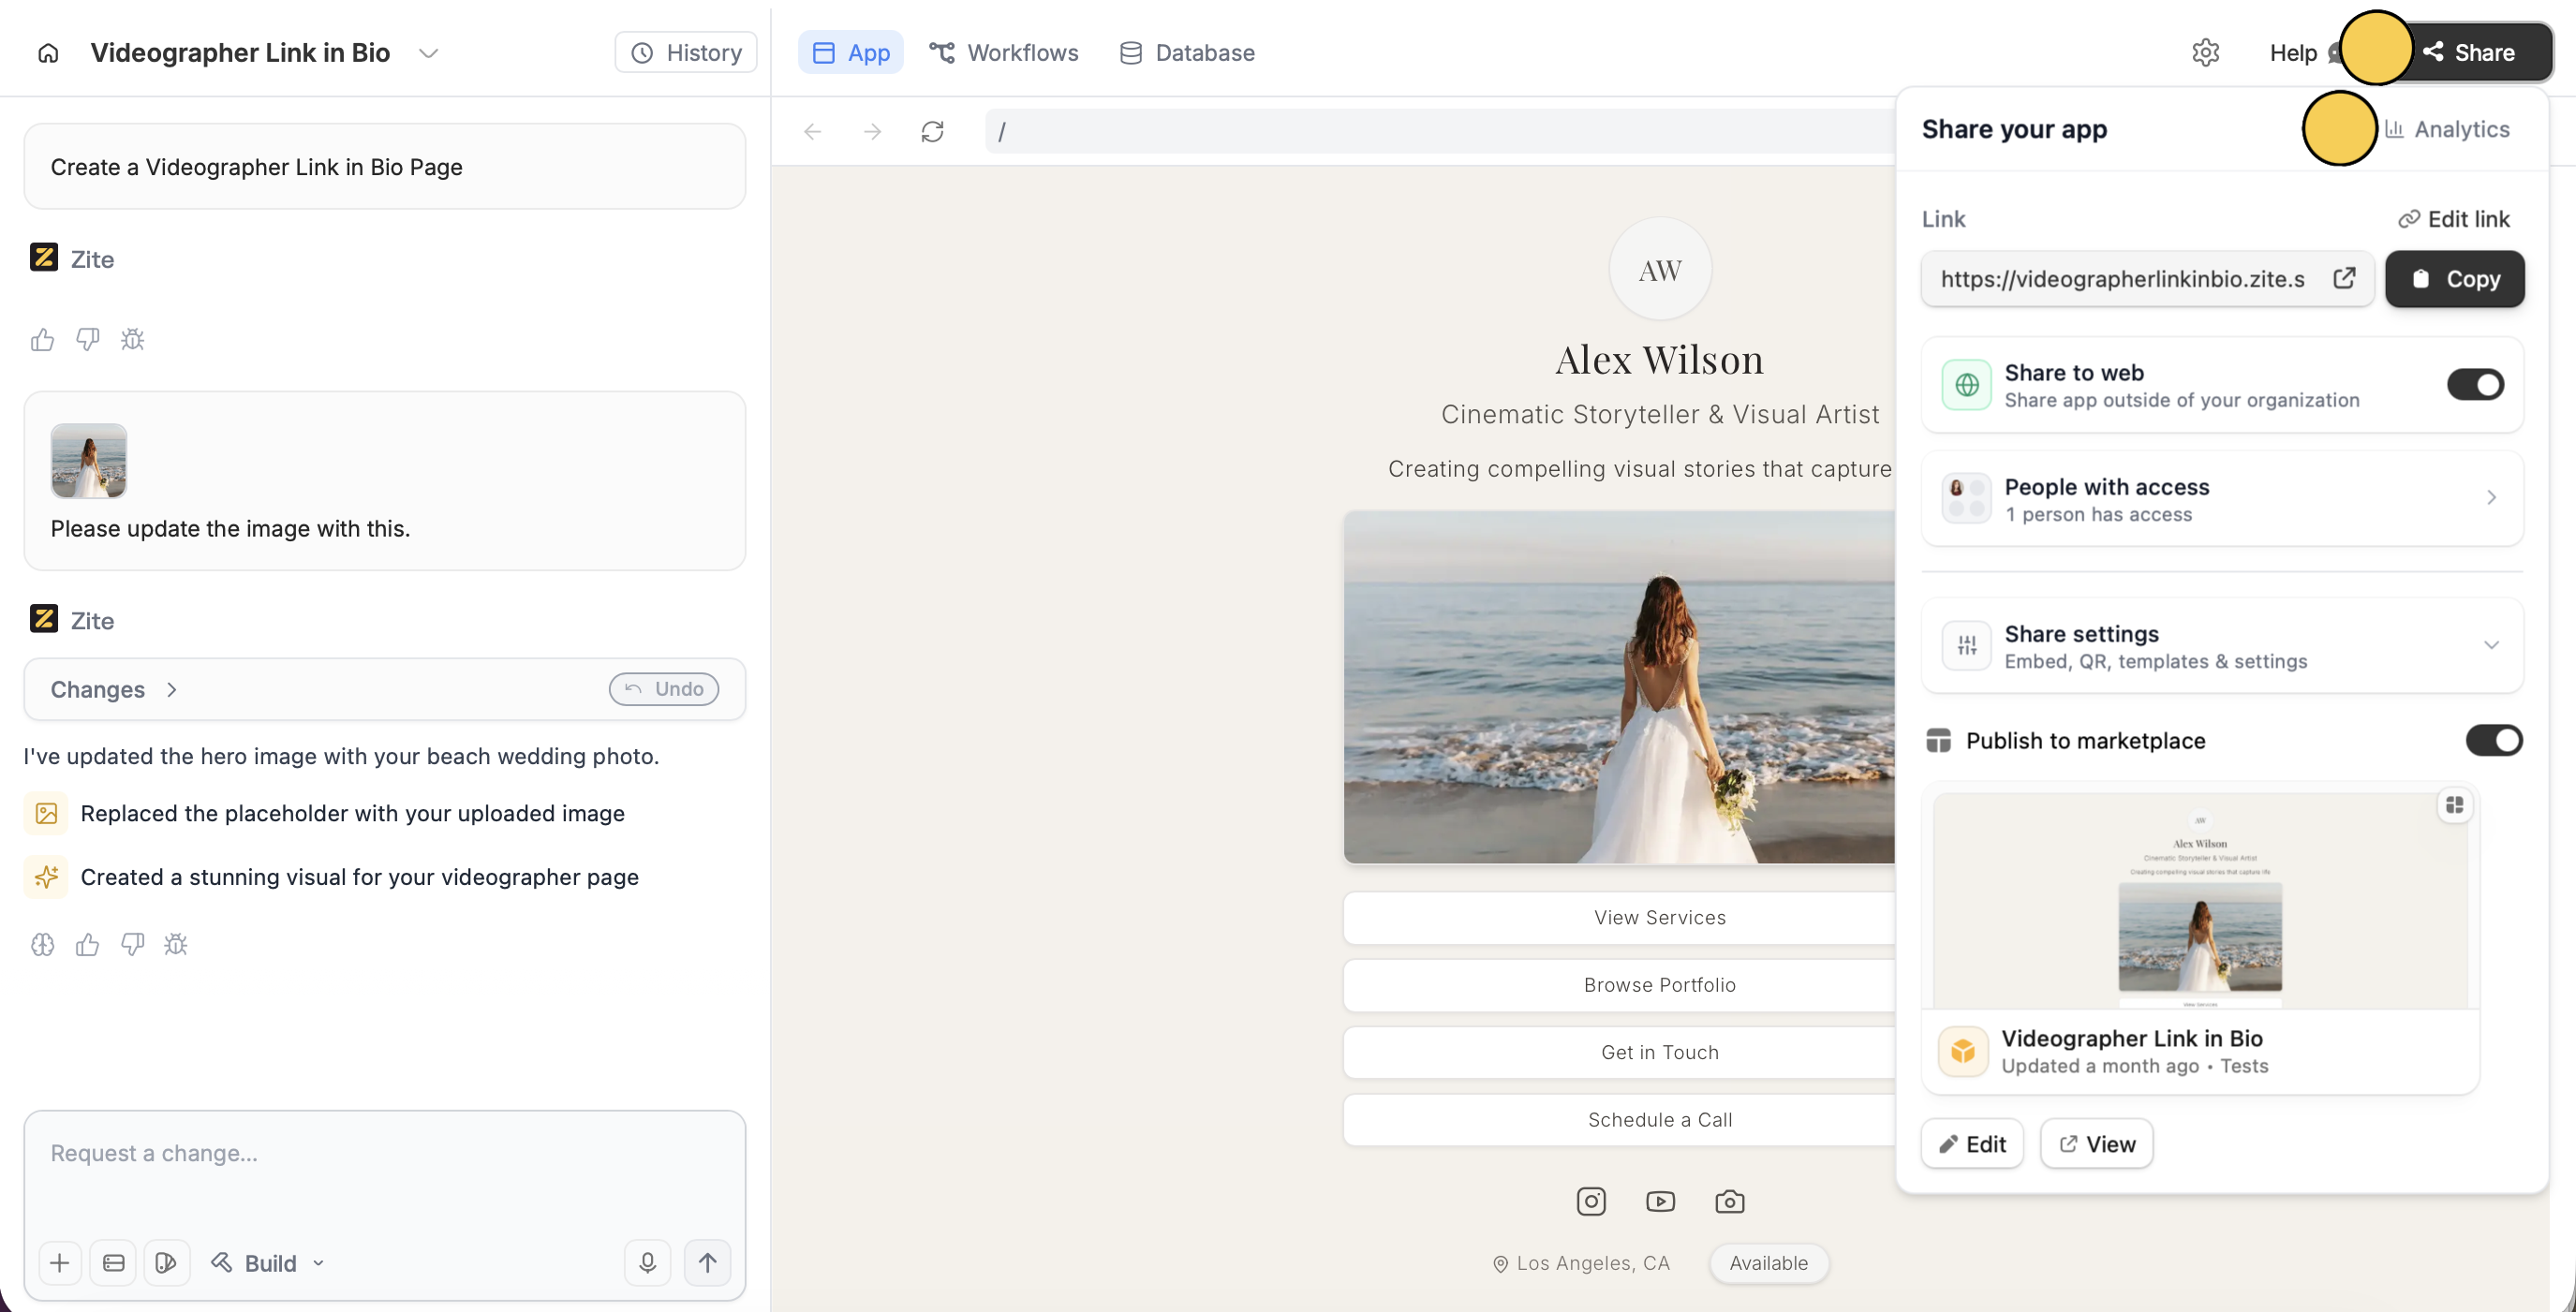
View app analytics
ClickShare followed by Analytics.
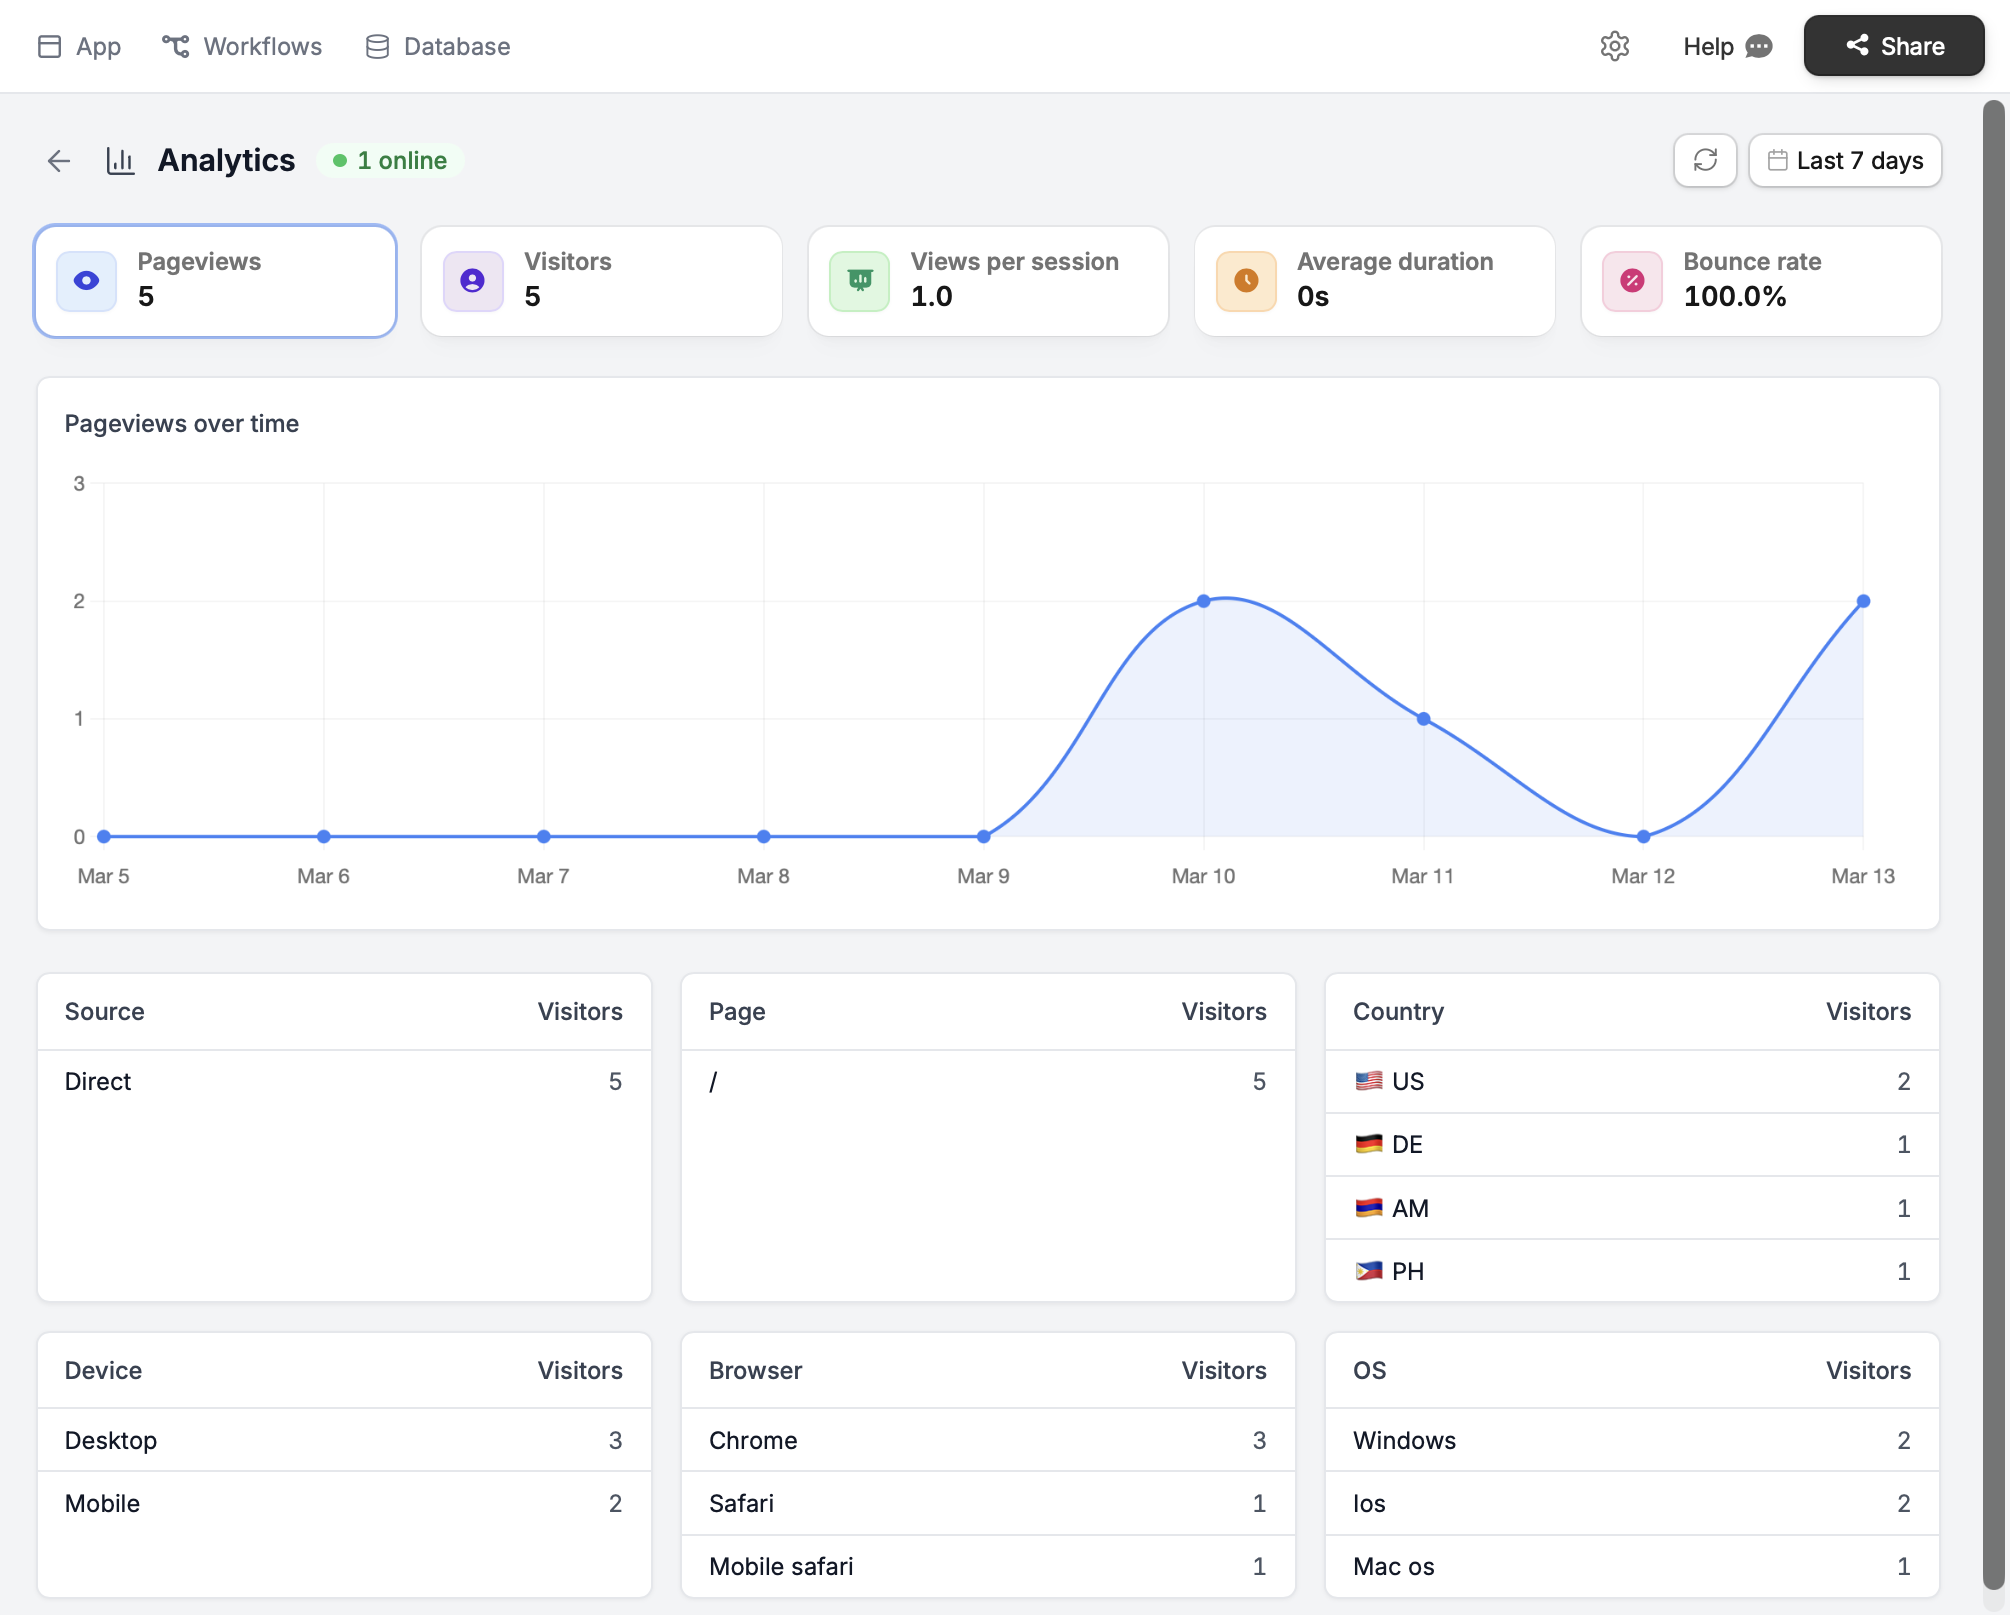
Key metrics you can track
- Pageviews – total pages viewed
- Visitors – unique users visiting, including how many are currently on it (green online badge)
- Views per session – average pages viewed per visit
- Average duration – how long users spend on your app
- Bounce rate – percentage of users leaving after one page
For apps with only one page, the bounce rate will always remain 100%.
Additional insights
At the bottom, it shows a list of where your visitors come from (source and country), how many visited each page, and what they used to visit (device, browser, and OS)./ under Pages refers to the homepage.
Filter views
By default, analytics shows performance for the last 7 days. ClickLast 7 days to filter by preset ranges or set a custom date range to see historical results.
